Amazon Search Query Performance Report Analyzer
Amazon's Brand Analytics Search Query Performance report provides sellers with valuable data about how customers find and interact with products through search. However, raw data alone can be overwhelming. Our tool transforms this data into actionable insights, helping you understand search performance and identify opportunities for growth.
Skip the explanantion and jump directly to the tool
Overview
This tool analyzes Amazon Brand Analytics Search Query Performance data through:
- Performance Metrics: Comprehensive overview of impressions, clicks, basket adds, and purchases
- Conversion Analysis: Detailed breakdown of conversion rates at each stage of the customer journey
- Query Insights: Identification of top-performing search terms and opportunities
- Visual Analytics: Interactive charts and visualizations for intuitive data exploration
- Opportunity Scoring: Algorithmic identification of high-potential search queries
How It Works
- Upload your Search Query Performance Report CSV file through the file uploader
- The dashboard automatically extracts your brand name and processes the data
- Navigate through different sections to explore various aspects of your search performance
Key Sections Explained
Metrics Overview
The first section provides a bird's-eye view of your performance with two important tables:
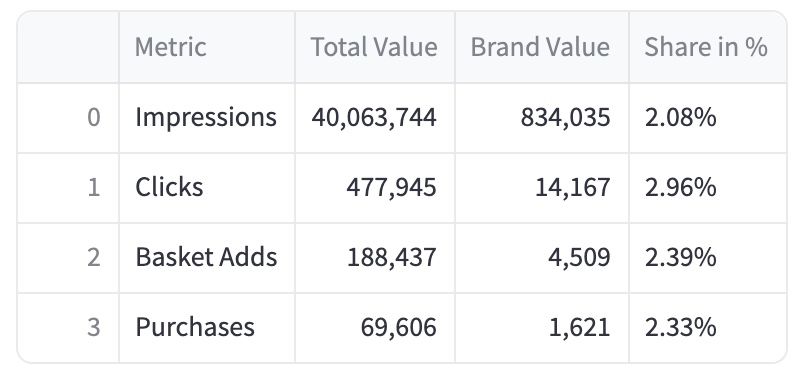
The Metrics Overview table shows:
- Total impressions, clicks, basket adds, and purchases across all products
- Your brand's specific numbers for each metric
- Your brand's percentage share of the total
This helps you understand your overall market presence and share of customer attention.
The Rates Overview table displays:
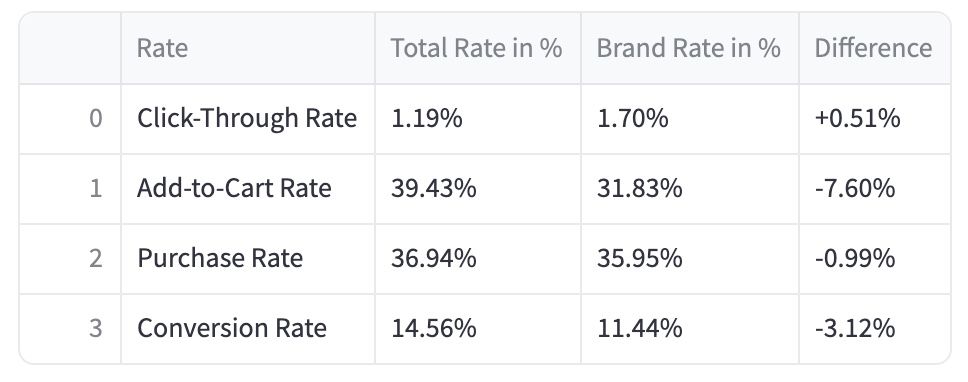
- Click-Through Rate (CTR): How often impressions convert to clicks
- Add-to-Cart Rate: How often clicks lead to basket adds
- Purchase Rate: How often basket adds convert to purchases
- Conversion Rate: The overall click-to-purchase rate
For each rate, you can compare your brand's performance against the market average, with a clear indicator of the difference.
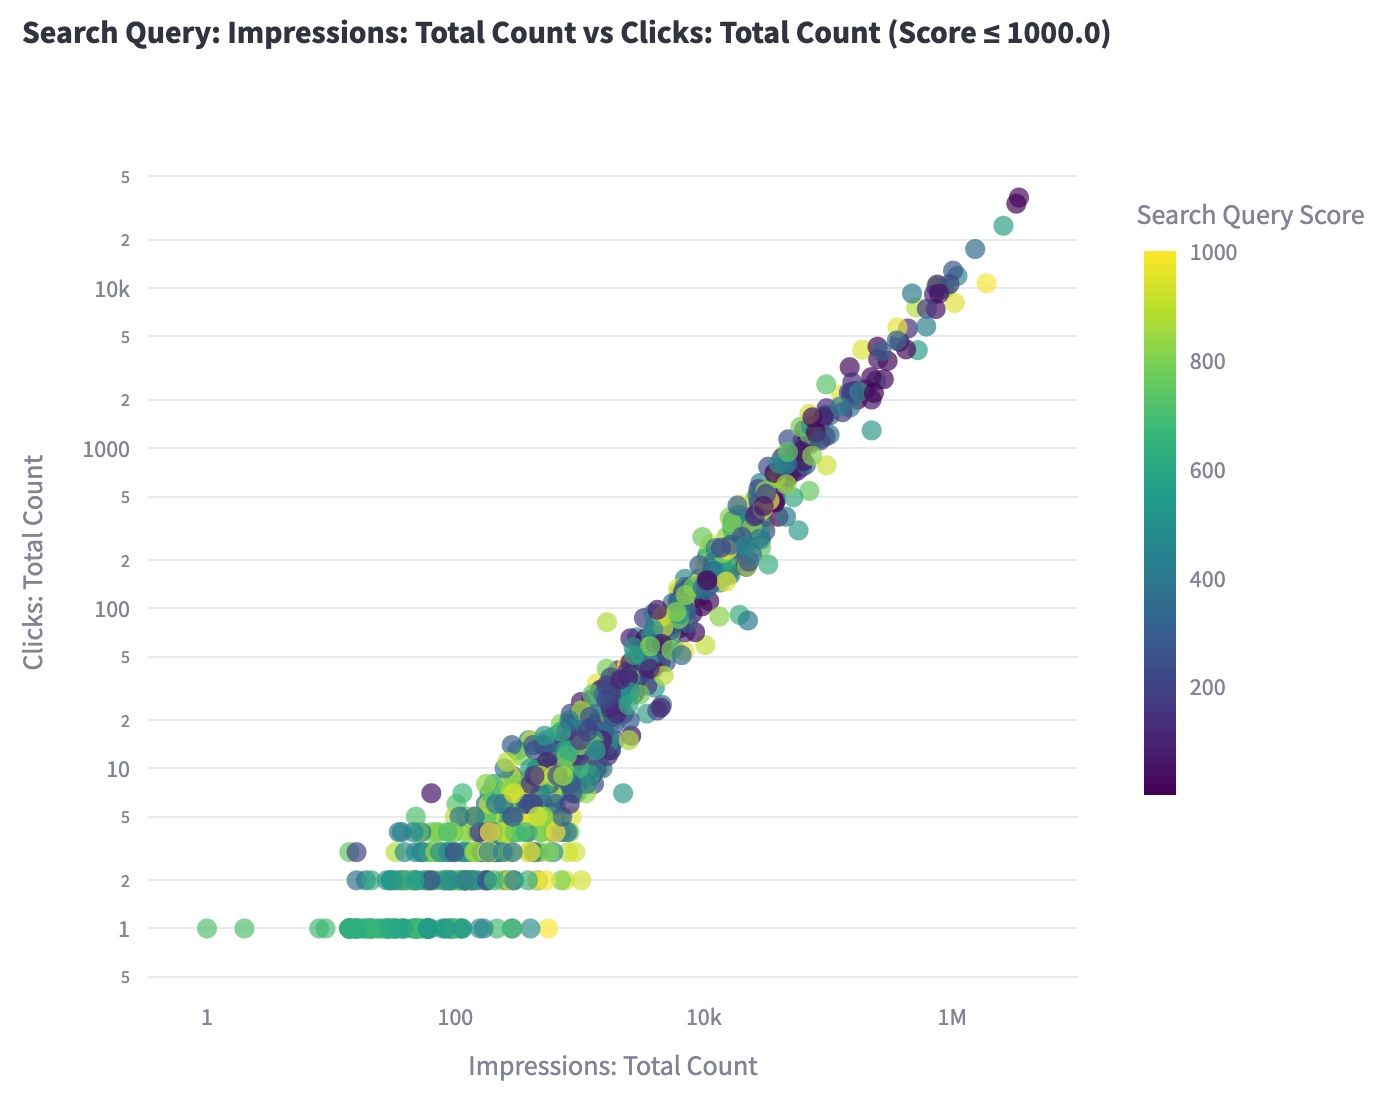
Interactive Scatter Plot
This visualization allows you to:
- Plot any two numeric metrics against each other
- Apply logarithmic scaling for better visualization of skewed data
- Filter queries by Search Query Score
- Hover over points to see detailed information about specific search terms
This helps identify outliers and understand relationships between different performance metrics.
Top Queries Analysis
Multiple tables highlight your top-performing queries across different metrics:
- Search Query Score (Amazon's relevance ranking)
- Search volume and impressions
- Brand impressions, clicks, basket adds, and purchases
These tables help you identify which search terms are most valuable for your brand.
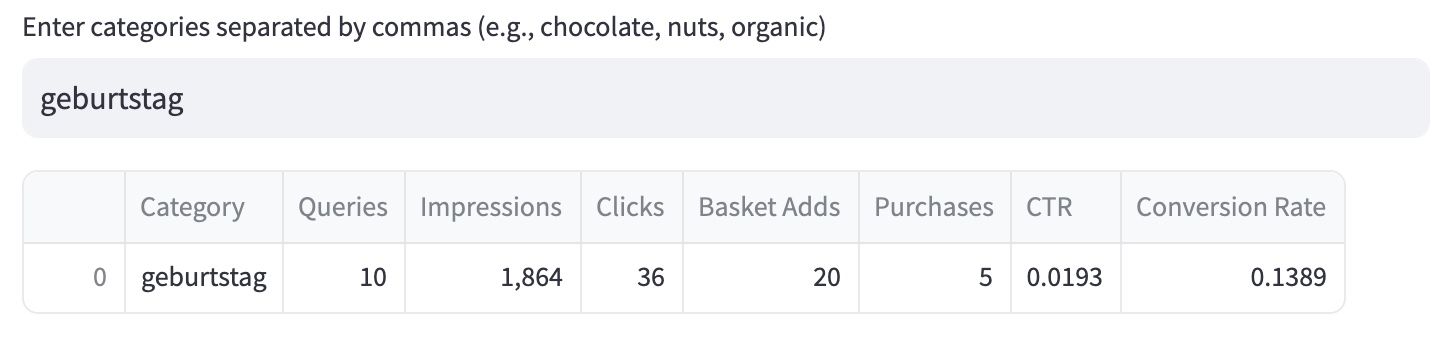
Query Category Analysis
This section allows you to:
- Define custom categories based on keywords
- Compare performance across different product categories
- Visualize category-specific conversion rates
This helps understand how different types of products or search intents perform.
Performance Quadrant Analysis
The quadrant visualization plots your queries based on:
- Click Volume (horizontal axis)
- Conversion Rate (vertical axis)
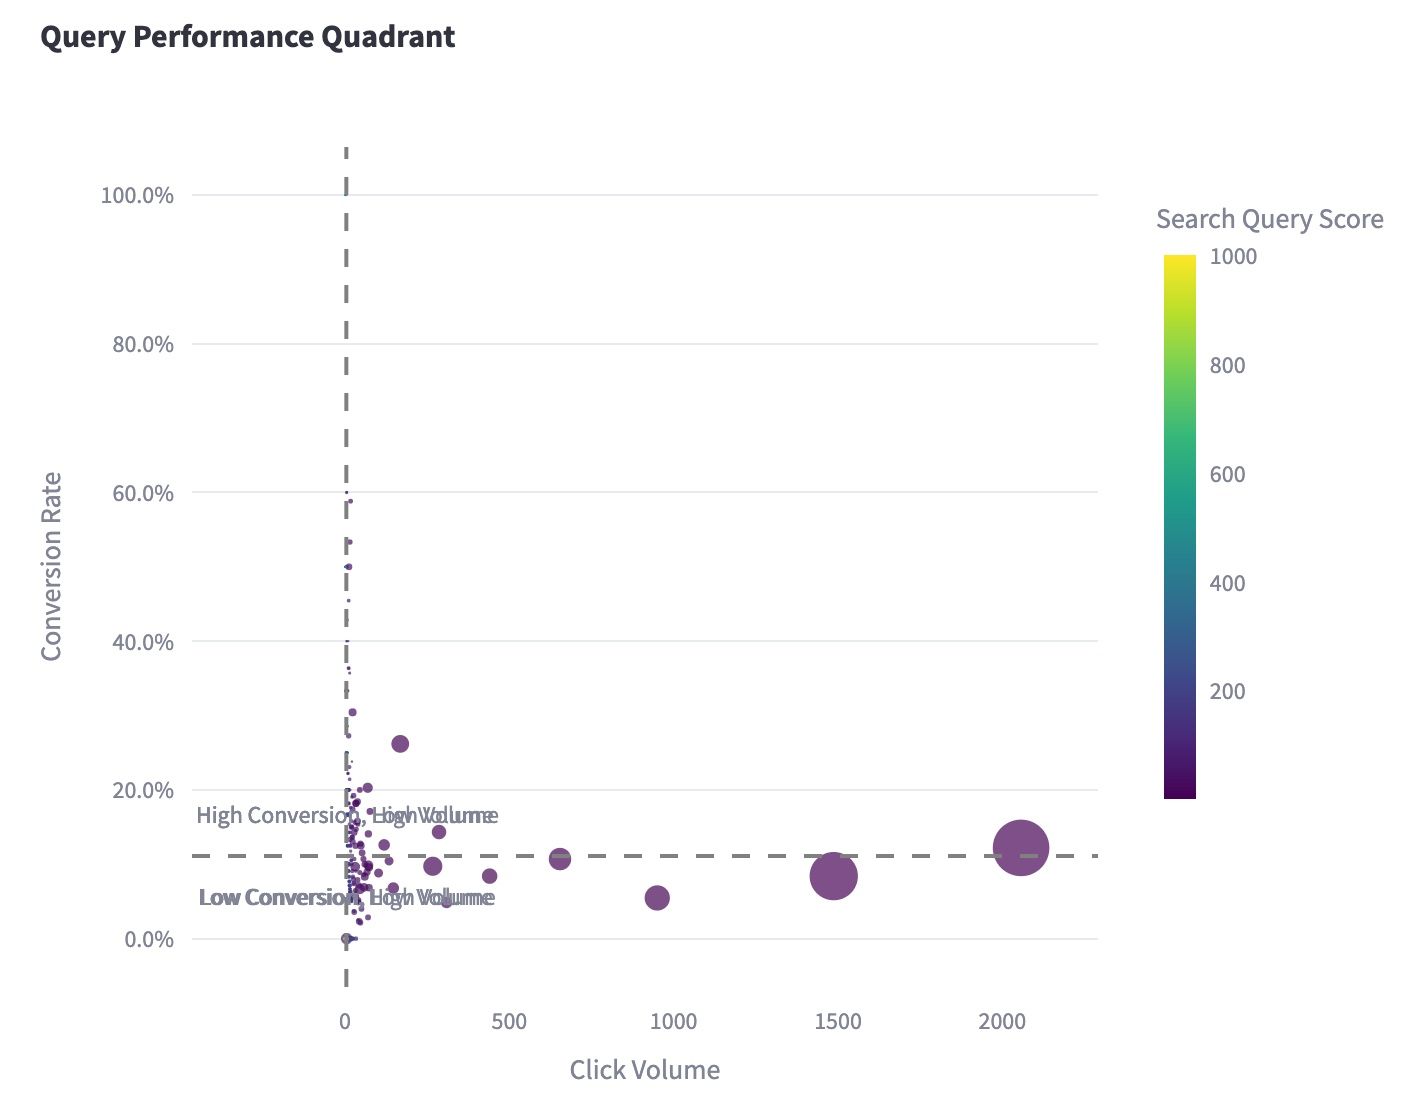
Dividing the plot into four quadrants helps prioritize your efforts:
- High Conversion, High Volume: Your star performers
- High Conversion, Low Volume: Growth opportunities
- Low Conversion, High Volume: Areas needing optimization
- Low Conversion, Low Volume: Lower priority queries
Word Cloud Visualization
The word cloud provides a visual representation of your top-performing queries based on your chosen metric. Larger words appear more frequently in successful searches, helping identify common themes and patterns.
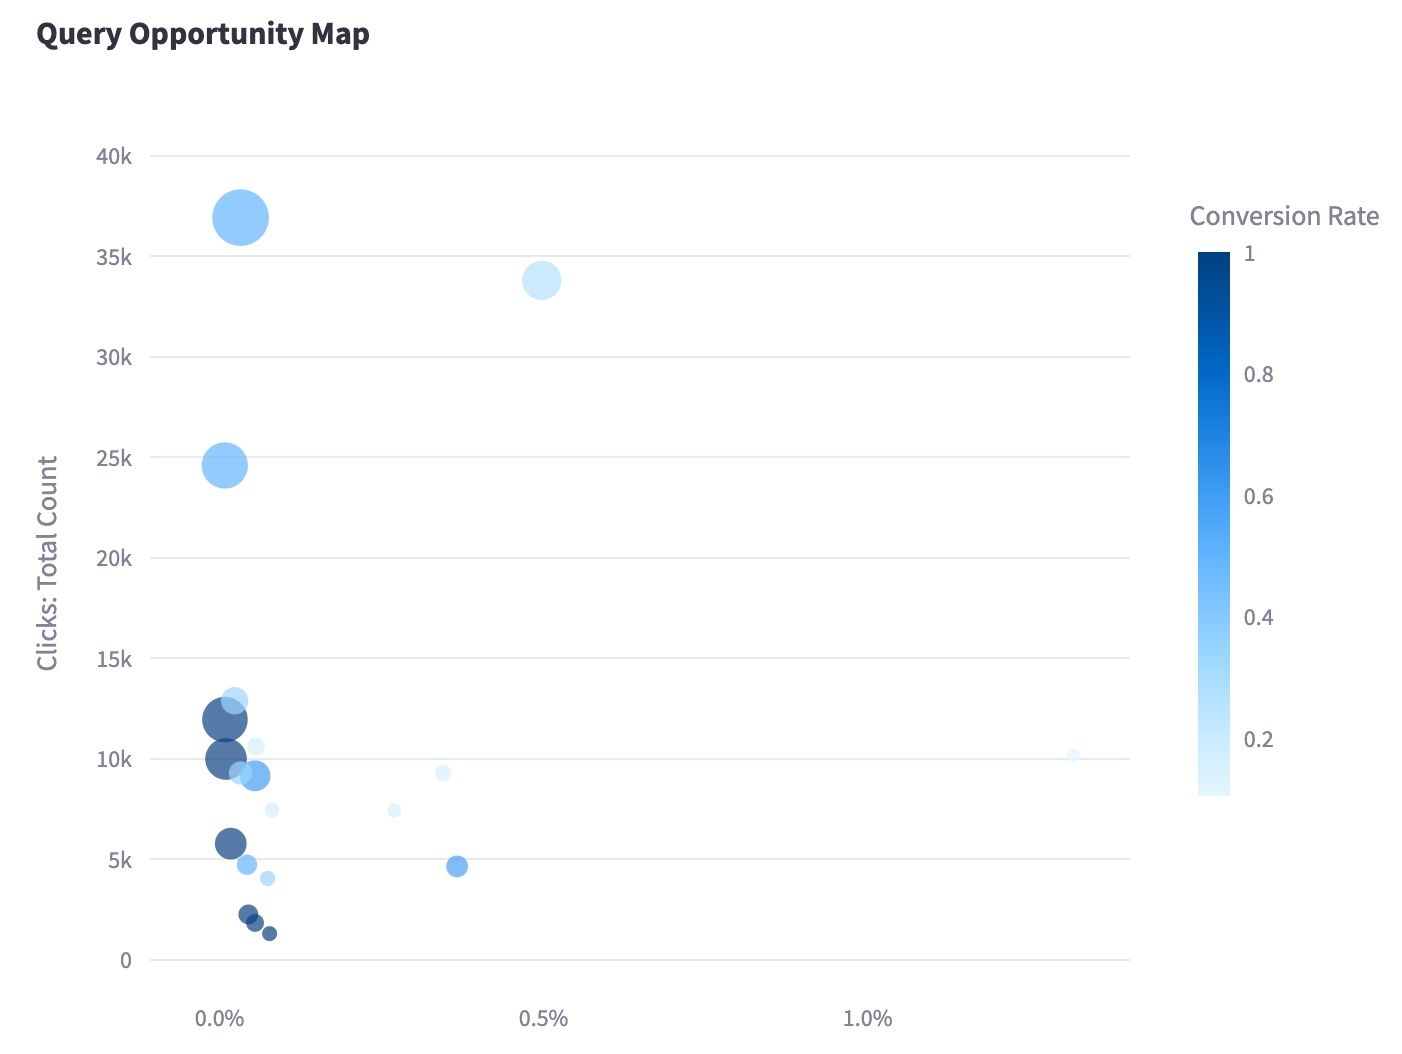
Opportunity Analysis
This final section calculates an "Opportunity Score" for each query based on:
- Total market demand (click volume)
- Your current brand share (room for growth)
- Conversion rate (proven purchase intent)
The resulting table and visualization highlight queries with the highest potential return on optimization efforts.
The tool
App does not wake up? Please click here to open it in stand-alone mode and wake it up there.
Business Benefits
This dashboard transforms raw data into strategic insights by helping you:
- Identify Valuable Keywords: Discover which search terms drive the most revenue
- Optimize Listings: Focus on improving visibility for high-opportunity queries
- Benchmark Against Competition: Understand how you perform relative to the market
- Prioritize Efforts: Focus resources on queries with the highest potential return
Even more data in AMALYTIX
If you are interested in more comprehensive information and deeper insights into the Search Query Performance Report, AMALYTIX offers effective support with its new analysis functions.
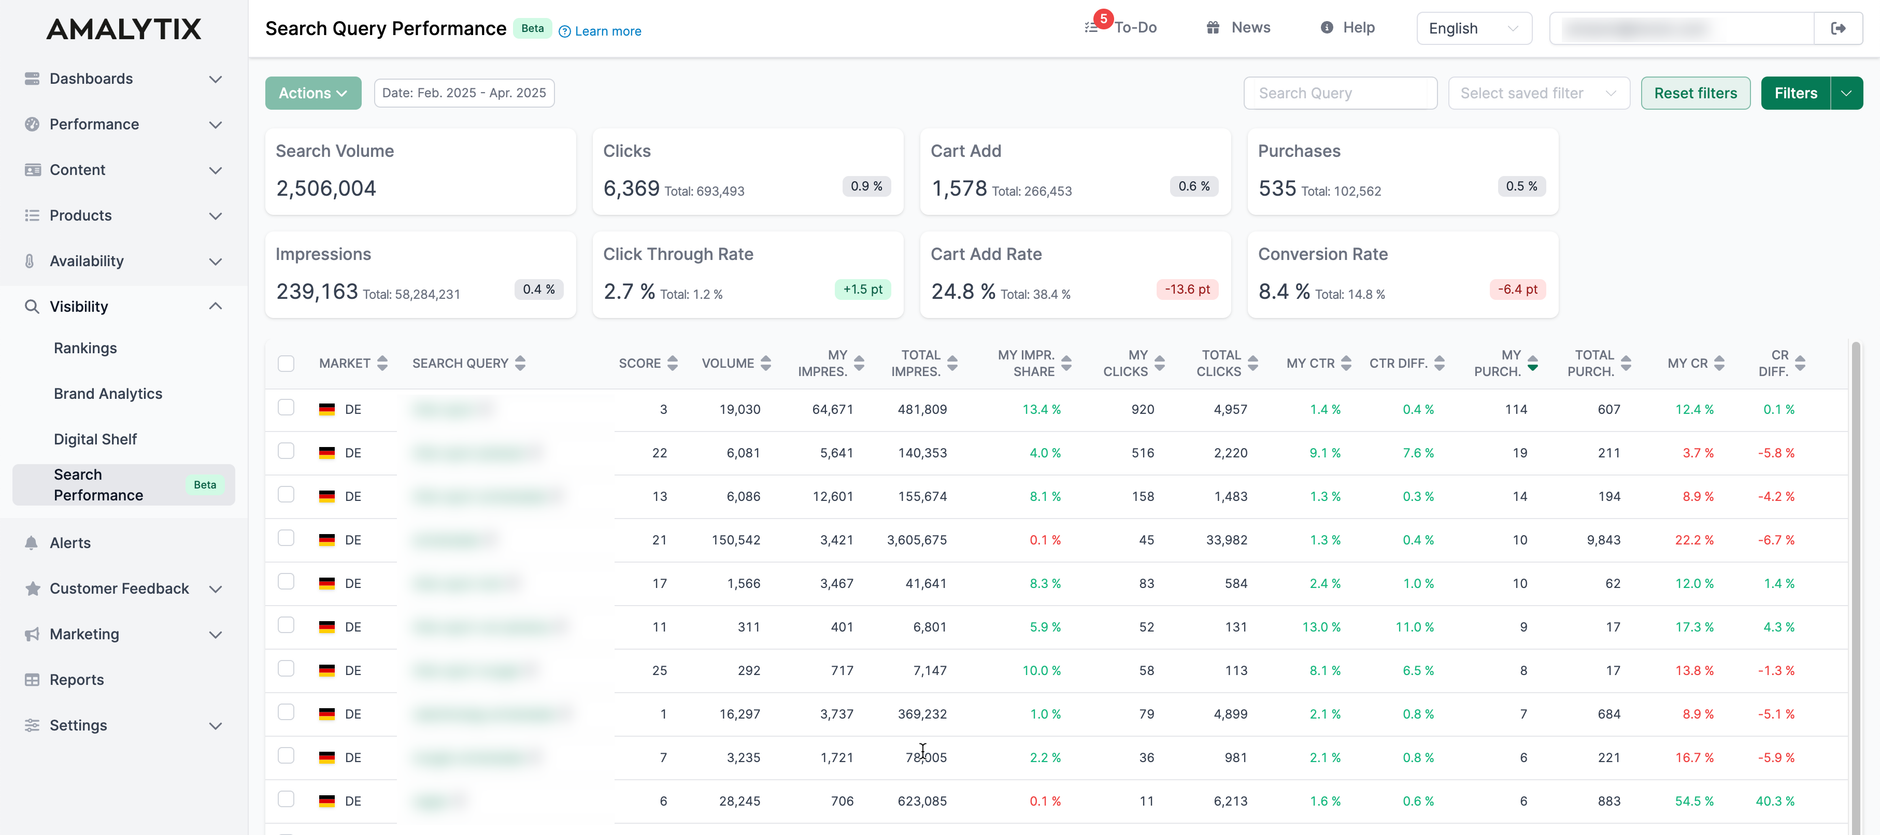
Our feature allows you to display aggregated key figures such as clicks and conversions over freely selectable time periods - ideal for recognizing seasonal fluctuations or long-term trends.
Thanks to precise filter options by brand and multiple ASINs (instead of just one as in Seller Central), you can analyze your data in a targeted manner.
In addition, historical data can be collected and compared over longer periods of time - a clear advantage for strategic decisions.
With AMALYTIX you not only maintain an overview, but also gain real competitive advantages.
Free trial
Just register for a 14-day free trial and we will show you how our Amazon Seller Tool and Amazon Vendor Tool can help you monitor your reviews on a daily basis. Start your free trial now
Conclusion
The Amazon Search Query Performance Dashboard transforms complex Brand Analytics data into clear, actionable insights. By visualizing your search performance and identifying opportunities, this tool helps you make data-driven decisions to improve your Amazon presence and drive growth.
Whether you're looking to optimize existing listings, identify new product opportunities, or better understand customer search behavior, this dashboard provides the insights you need to succeed in Amazon's competitive marketplace.