
Amazon Search Catalog Performance Report Analyzer
The Search Catalog Performance report in Amazon Brand Analytics provides valuable insights, but analyzing this data effectively can be challenging. In this post, we'll provide you with a free but powerful tool that transforms raw Amazon catalog data into actionable insights.
Skip the explanation and jump directly to the tool
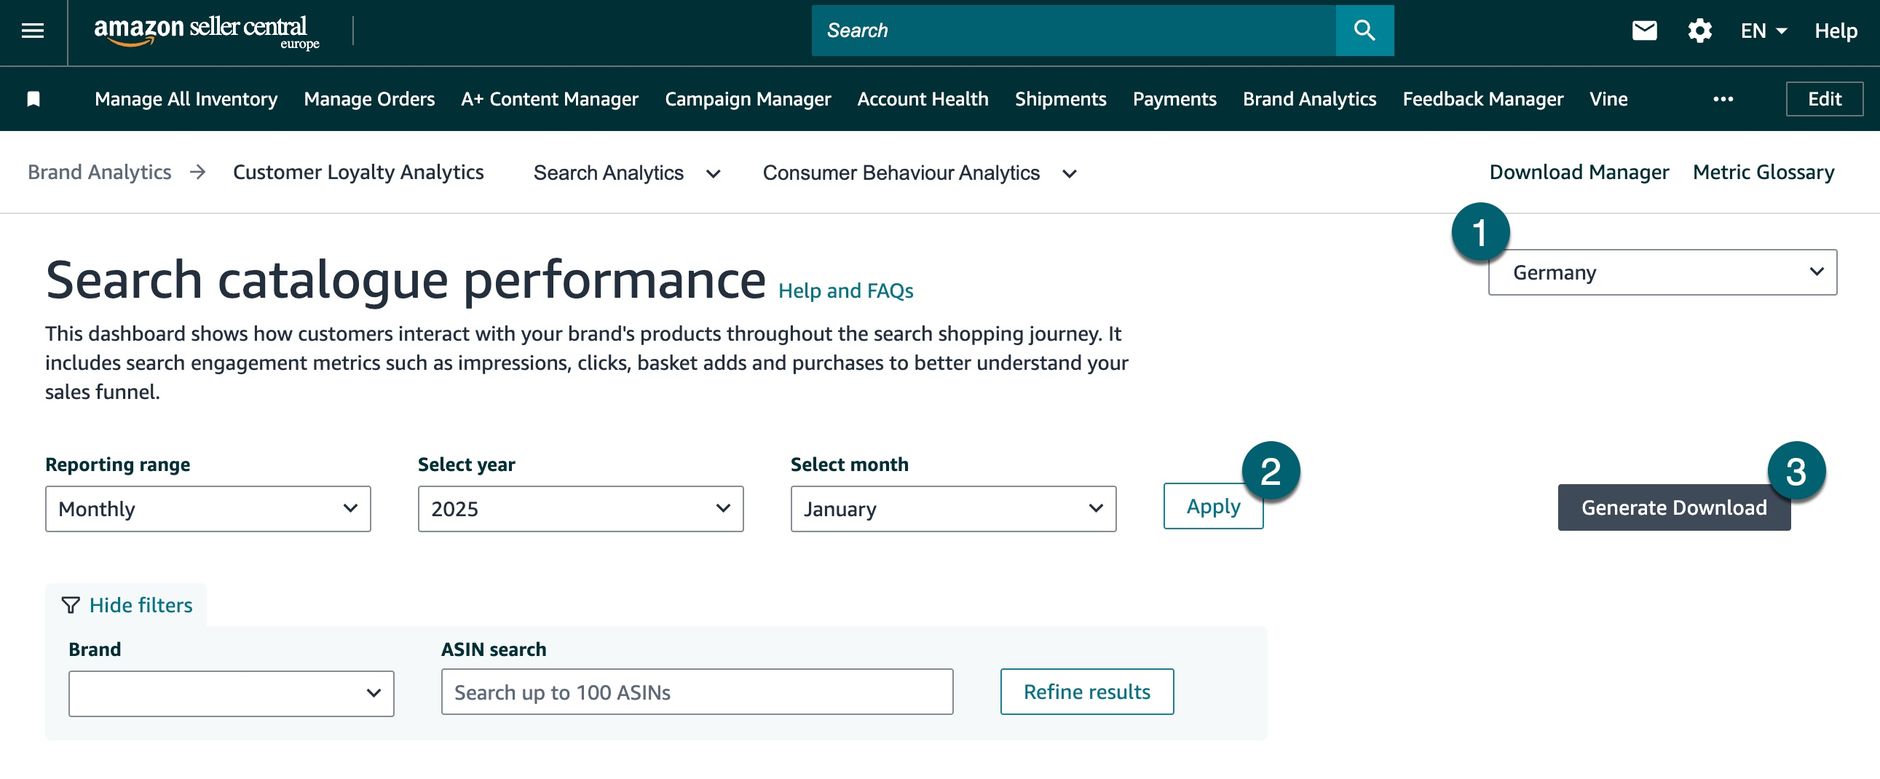
Where do I find this report?
You can download the Search Catalog Performance Report in Seller Central under Amazon Brand Analytics.
Language settings
Download this report in English to ensure the tool processes it correctly.
What is the Search Catalog Performance Analysis Tool?
This tool is designed to help Amazon sellers and brand owners analyze their catalog performance data. It provides visualizations and metrics that make it easy to understand.
Let's dive into how this tool works and what insights you can gain from it.
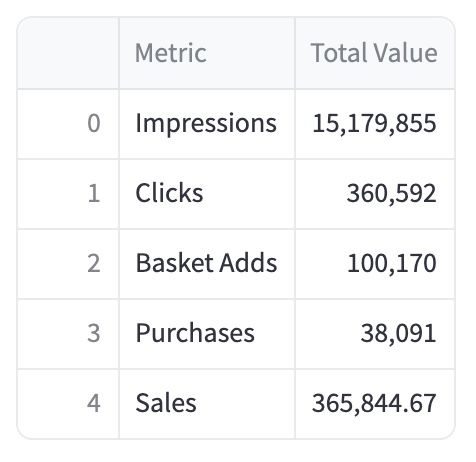
Performance Metrics
The tool calculates and displays two important sets of metrics:
- Total Impressions
- Total Clicks
- Total Basket Adds
- Total Purchases
- Total Sales
Performance Rates
- Click-Through Rate (CTR) = Clicks / Impressions
- Add-to-Cart Rate = Basket Adds / Clicks
- Purchase Rate = Purchases / Basket Adds
- Conversion Rate = Purchases / Clicks

These metrics provide a high-level view of your catalog's performance and help identify areas for improvement.
Conversion Rate Distribution Analysis
Understanding how conversion rates are distributed across your products can reveal valuable insights. The tool provides:
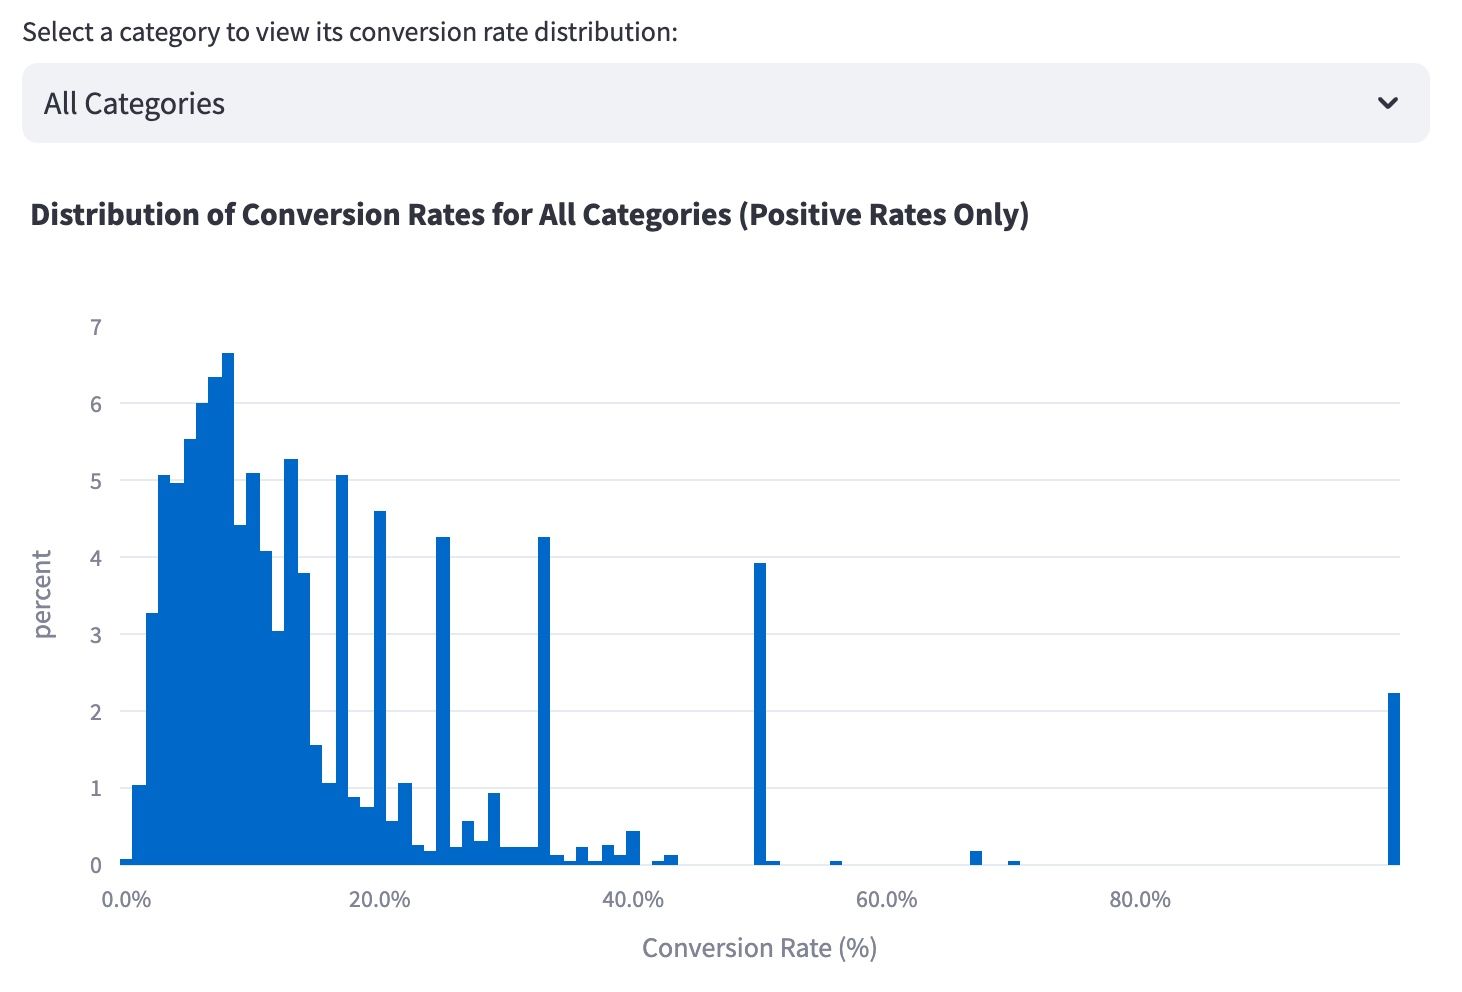
- A histogram showing the distribution of conversion rates
- A category filter to analyze specific product categories
- Statistical analysis of the distribution (mean, median, percentiles, etc.)
- Automatic filtering of zero-conversion products for clearer visualization
The distribution statistics help you understand what "good" conversion rates look like for your catalog and identify benchmarks for improvement.
Quadrant Analysis
Perhaps the most powerful feature is the quadrant analysis, which plots products based on:
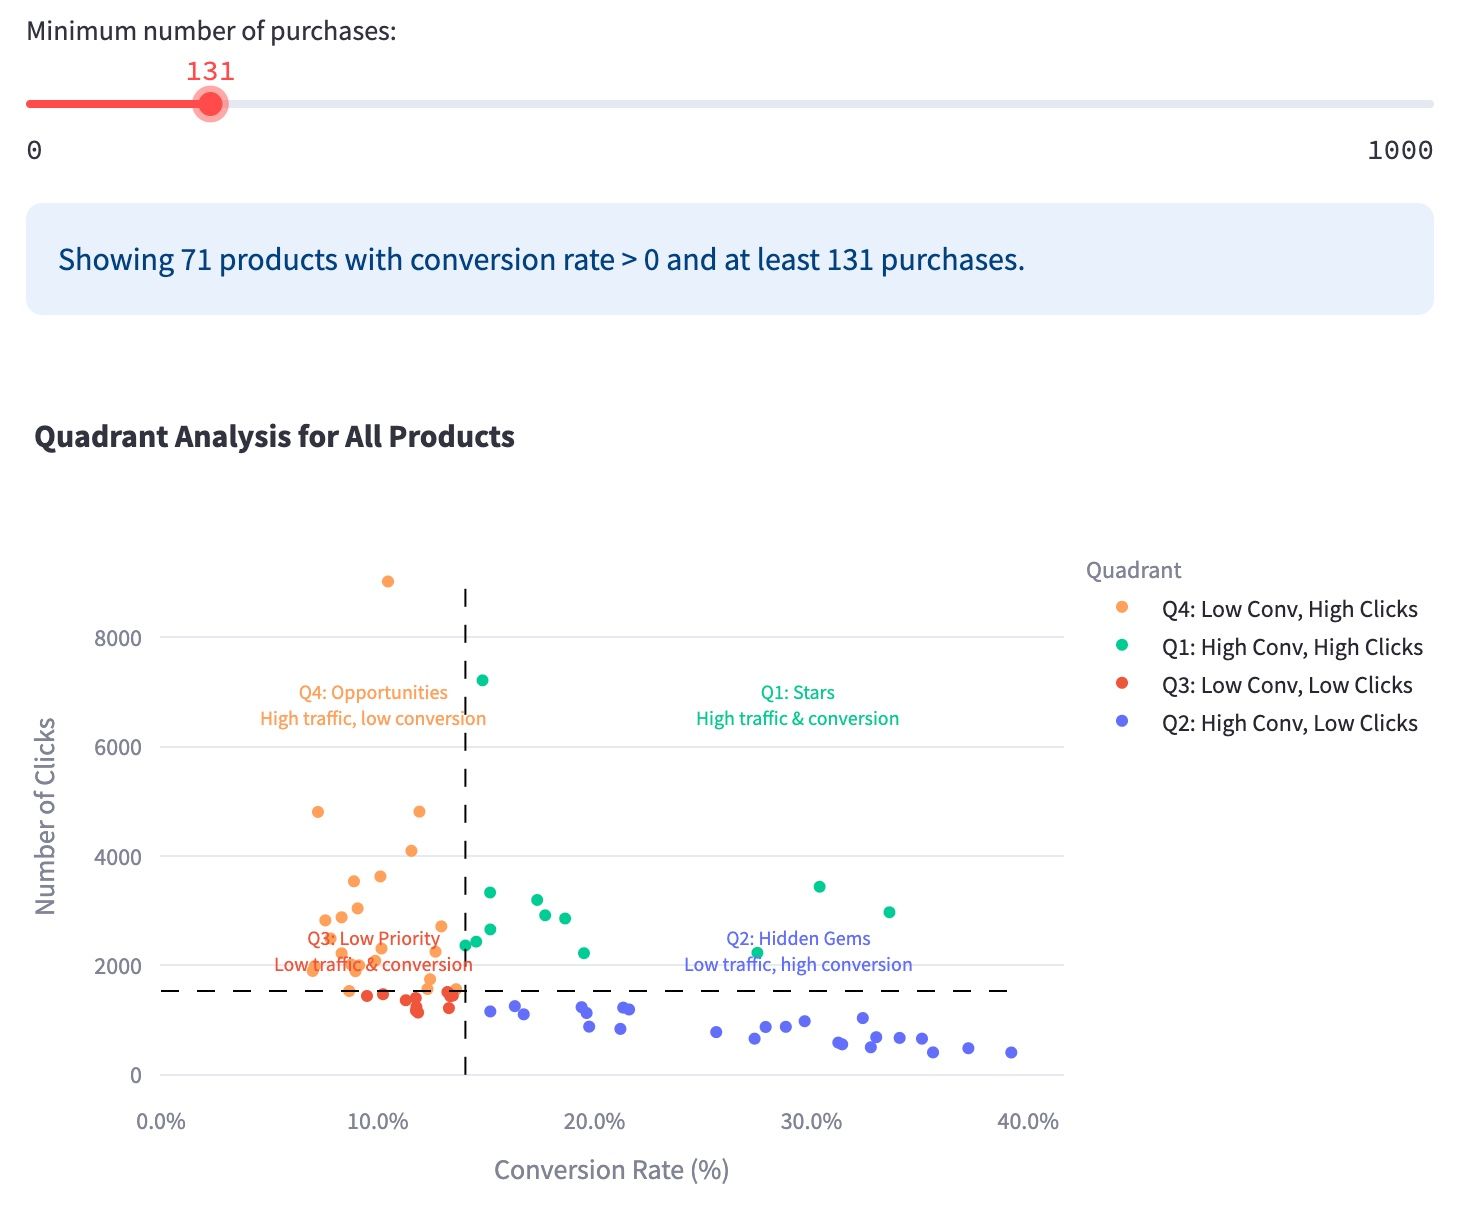
- Conversion Rate (x-axis)
- Click Volume (y-axis)
Products are categorized into four quadrants:
Q1: Stars (High Conversion, High Clicks) These are your top performers that receive significant traffic and convert well. They deserve continued support and can serve as models for other products.
Q2: Hidden Gems (High Conversion, Low Clicks) These products convert well but don't receive much traffic. Consider increasing visibility through advertising or improved search optimization.
Q3: Low Priority (Low Conversion, Low Clicks) These underperforming products may need significant improvements or deprioritization in your strategy.
Q4: Opportunities (High Clicks, Low Conversion) These products receive good traffic but don't convert well. Focus on improving listings, pricing, or product quality to capitalize on existing traffic.
The quadrant analysis includes:
- A category filter to focus on specific product segments
- A minimum purchases filter to exclude products with limited data
- Interactive hover information showing product titles and key metrics
- Clear visual indicators of median values and quadrant boundaries
The tool
App does not wake up? Please click here to open it in stand-alone mode and wake it up there.
Conclusion
The Search Catalog Performance Analysis tool transforms raw Amazon data into actionable insights. By visualizing conversion rates and categorizing products into strategic quadrants, it helps sellers and brand owners:
- Identify their best and worst-performing products
- Discover opportunities for improvement
- Make data-driven decisions about their Amazon catalog
Whether you're managing a small catalog or thousands of products, this tool provides a structured approach to understanding and improving your performance on Amazon.