Product detail page
The product detail page is your central hub for analyzing a single product in depth. Here you can see all key metrics at a glance and track historical developments - for example, how the price, bestseller rank, or number of reviews have changed over time.
To access the product detail page, click on Products and then on the product title from the overview page (Seller Products, Vendor Products, or Watchlist).
Header section
The header section of the product detail page shows you the most important product information at a glance:
- Product image and title: The main image and full product title
- Child ASIN and Parent ASIN: With direct links to the Amazon product page
- Variants: Which other variants belong to this parent product
- Other markets: On which other marketplaces this product is listed
- LQI: The Listing Quality Index (Watchlist products only)
- Last updated: When the data was last retrieved
- Category: The full category hierarchy on Amazon
- EAN and Part number: Product identification numbers
Tabs
The product detail page is divided into different tabs that contain different information depending on the product type (Seller, Vendor, Watchlist).
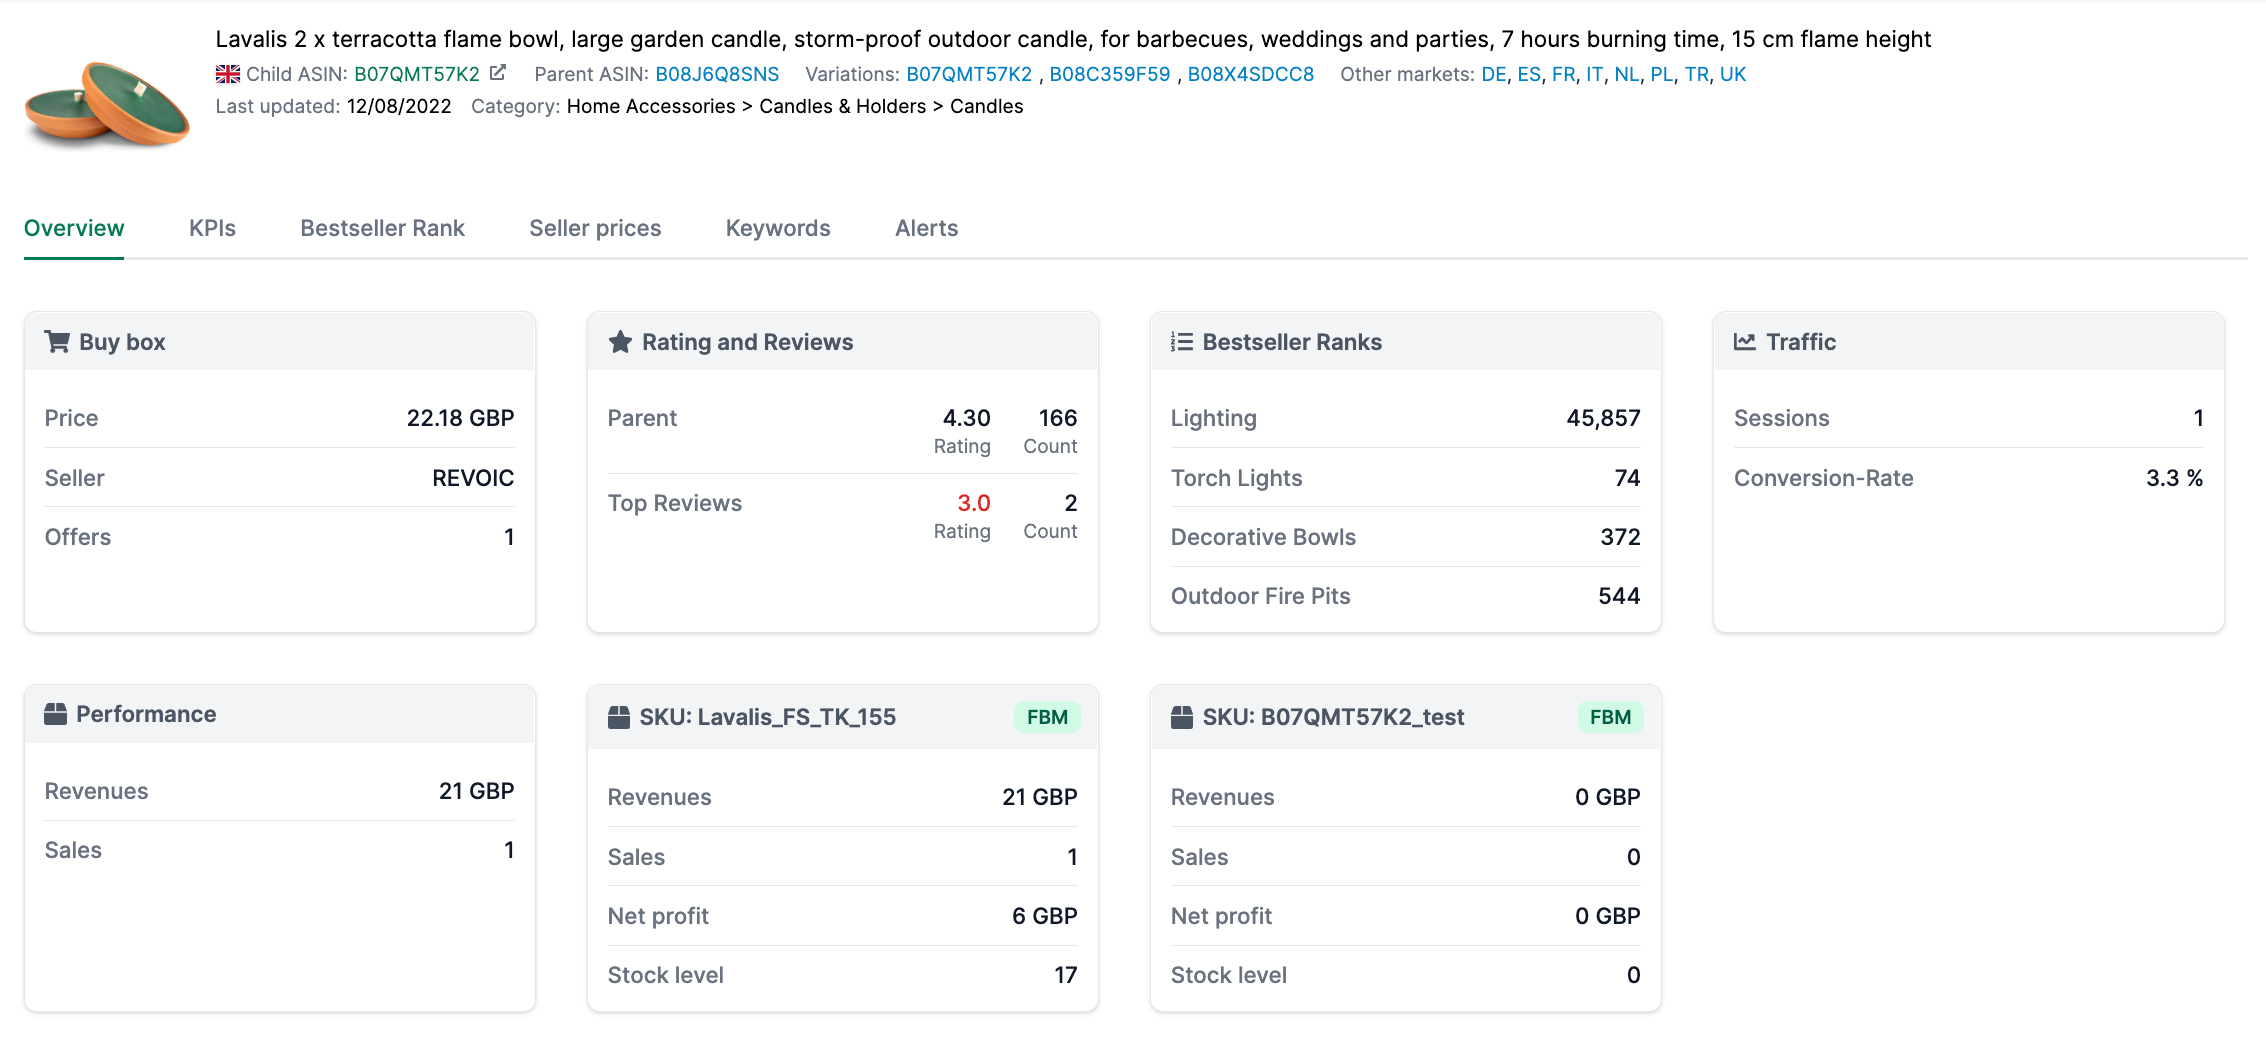
Overview
The Overview tab shows you your product’s current metrics in clear information cards:
Seller Products
| Section | Description | Benefit |
|---|---|---|
| Buy Box | Shows the current Buy Box price, which seller holds the Buy Box, the number of offers, and the average price over the last 28 days. | Keep track of your price position and competition. |
| Rating and Reviews | The average rating and number of reviews at parent level, plus ratings from top reviews. | Understand customer satisfaction and your product’s reputation. |
| Bestseller Ranks | Your bestseller rank in the main category and all subcategories. | The lower the rank, the better your product sells compared to competitors. |
| Session / Conversions | Average sessions and conversion rate over the last 30 days. | Understand how many visitors your product page has and how many of them buy. |
| Revenue / Sales all SKUs | Total revenue and units sold across all SKUs. | See overall performance regardless of individual SKUs. |
| SKU Cards | For each SKU: Revenue, sales, net profit, and current stock level. | Analyze the performance of each individual SKU separately. |
| Coupon | Current coupon information: discount amount, redemptions/clips, budget, and end date. | Track the success of your coupon campaigns. |
| Promotion | Current promotions: units sold, revenue, start and end date. | Analyze the effectiveness of your promotional activities. |
Vendor Products
| Section | Description | Benefit |
|---|---|---|
| Buy Box | Price, Buy Box holder, number of offers, and average price. | Monitor the pricing situation on your listing. |
| Rating and Reviews | Rating and review count at parent level plus top reviews. | Keep track of customer ratings. |
| Bestseller Ranks | Rank in main and subcategories. | Understand your market position. |
| Performance (sourcing) | Revenue and sales over the last 28 days from the Vendor sourcing report with percentage comparison to previous period. | Track sourcing performance. |
| Performance (manufacturing) | Revenue and sales over the last 28 days from the Vendor manufacturing report with percentage comparison. | Analyze manufacturing performance. |
| Coupon / Promotion | Same as Seller Products, if available. | Track your promotional activities. |
Watchlist
| Section | Description | Benefit |
|---|---|---|
| Buy Box | Price, seller, number of offers, and average price. | Monitor prices and Buy Box situation of competitors. |
| Rating and Reviews | Rating and review count at parent level plus top reviews. | Compare customer satisfaction with your own products. |
| A+ Content | Whether A+ Content, A+ Brand Story, or A+ Comparison Table is present. | Analyze which content elements competitors use. |
| Images/Videos | Number of images and videos, high-resolution images, and whether the main image has a white background. | Compare content quality. |
| Bestseller Ranks | Rank in main and subcategories. | Evaluate competitors’ market positions. |
| Content | Listing Quality Index (LQI), title length, number of bullet points, and keyword length in bytes. | Analyze listing quality in detail. |
KPIs
In the KPIs tab, you can analyze various metrics over a freely selectable time period. This helps you identify trends and correlations - for example, whether a price change has led to a change in sales.
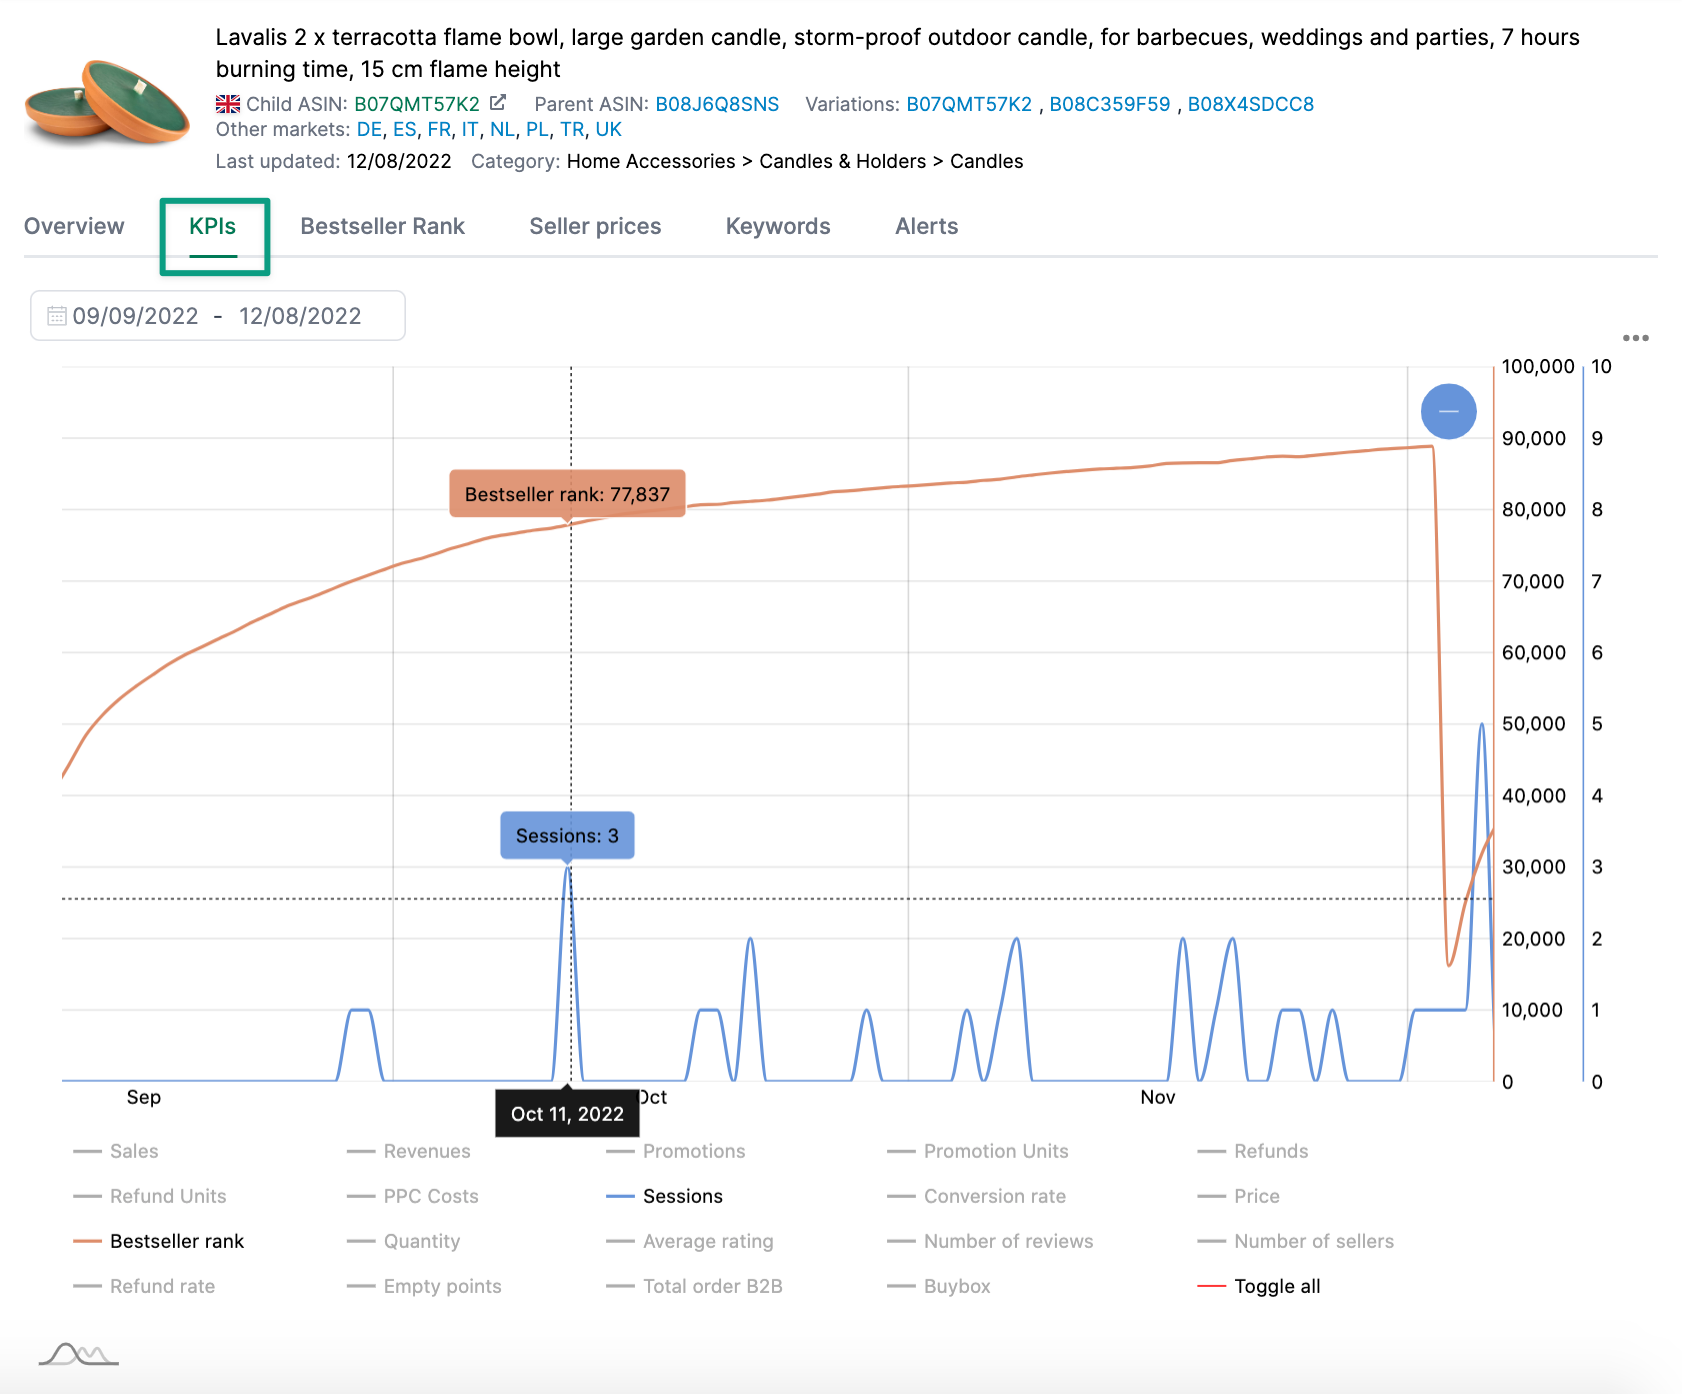
Available KPIs for Seller Products
- Sales (units)
- Revenue
- Discounts
- Refunds
- Refund Rate
- PPC Costs
- Sessions
- Conversion Rate
- Price
- Bestseller Rank
- Average Rating
- Number of Reviews
- Number of Sellers
- Total Order B2B
- Buy Box
Available KPIs for Vendor Products
- Shipped Units
- COGS (Cost of Goods Sold)
- Returned Units
- Selling Price
- Unsellable Units
- Unsellable Cost
- Received Units
- Ordered Units
- Number of Reviews
- Average Rating
- Price
- Number of Sellers
- Bestseller Rank
Available KPIs for Watchlist
- Price
- Number of Sellers
- Average Rating
- Number of Reviews
Bestseller Rank TL
The Bestseller Rank TL (Timeline) tab shows you how the bestseller ranks have developed over time - both for the main category and all subcategories.
![]()
Seller Prices
The Seller Prices tab shows you the price development of different sellers on your listing over time. This helps you understand:
- When competitors changed their prices
- Whether other sellers systematically undercut your price
- How the market price is developing overall

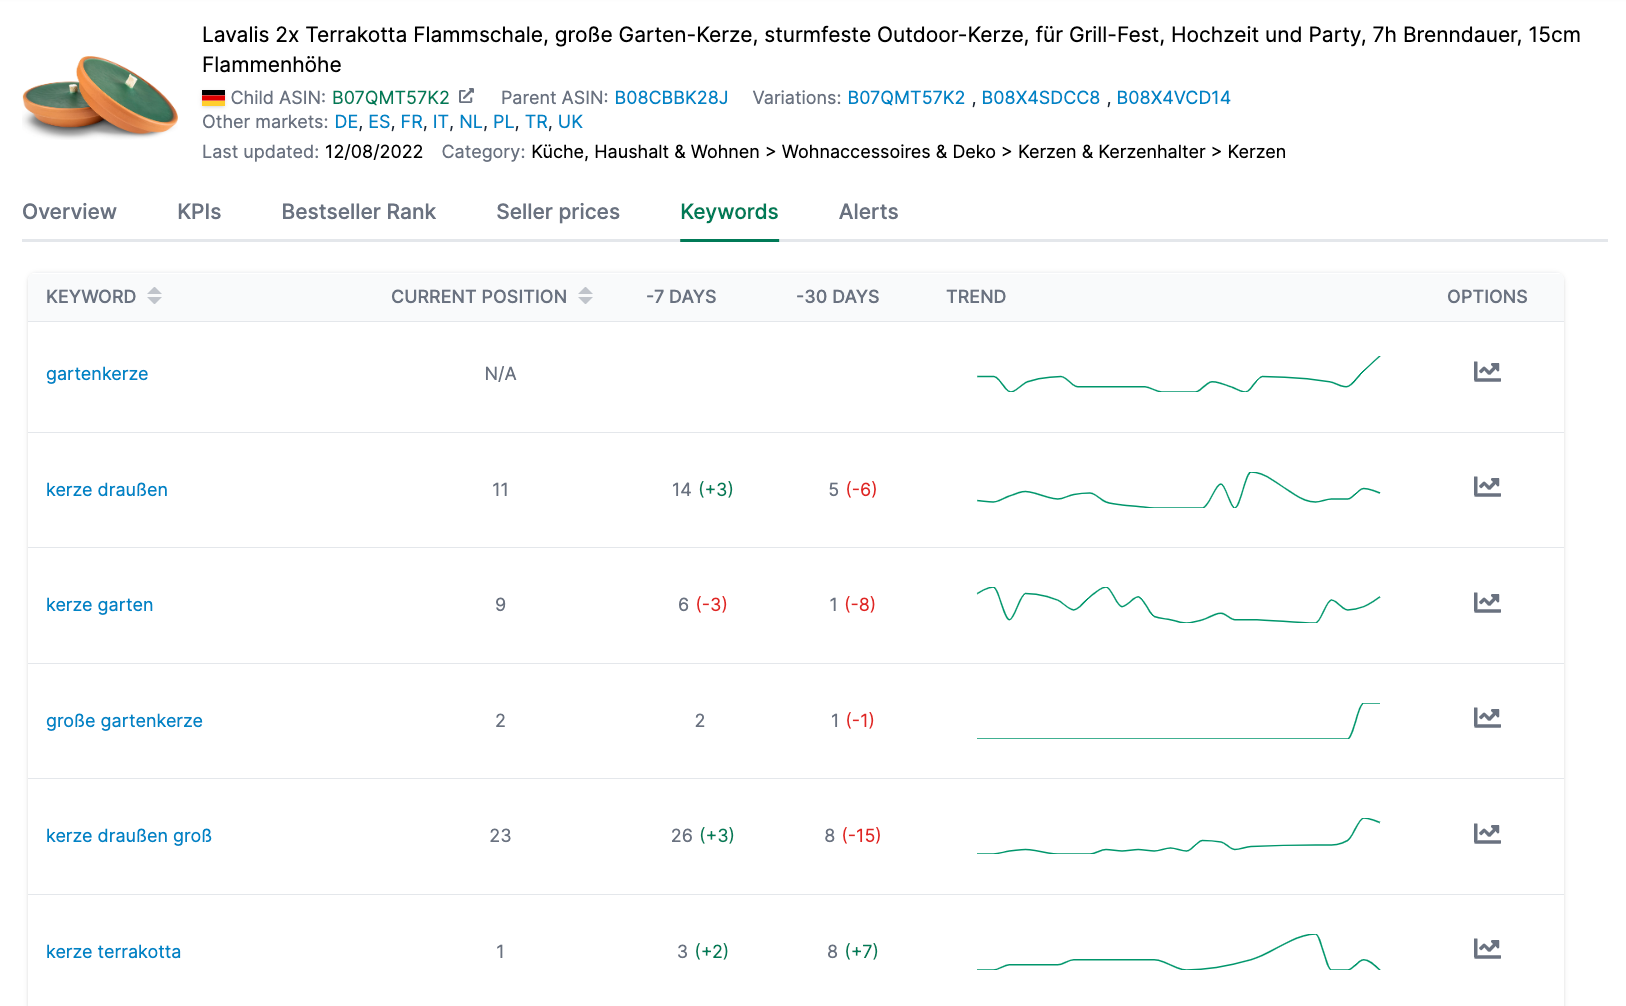
Rankings
The Rankings tab shows you where your product ranks for your important search terms. The data is taken from Visibility > Rankings.
For each keyword, we show you:
- The current position in organic search results
- The development over the last 7 and 30 days
- A heatmap or trend line to visualize the ranking history
You can switch between two views:
- Heatmap: Shows rankings for the last 20 weeks color-coded (green = good position, red = poor position)
- Line: Shows a trend chart for each keyword
Alerts
The Alerts tab shows you all alerts that AMALYTIX has generated for this product during the selected period. Examples include:
- Content changes to the listing
- Price changes
- Availability changes
- Buy Box losses
- Rating changes
This allows you to quickly see what changed on your product and when.
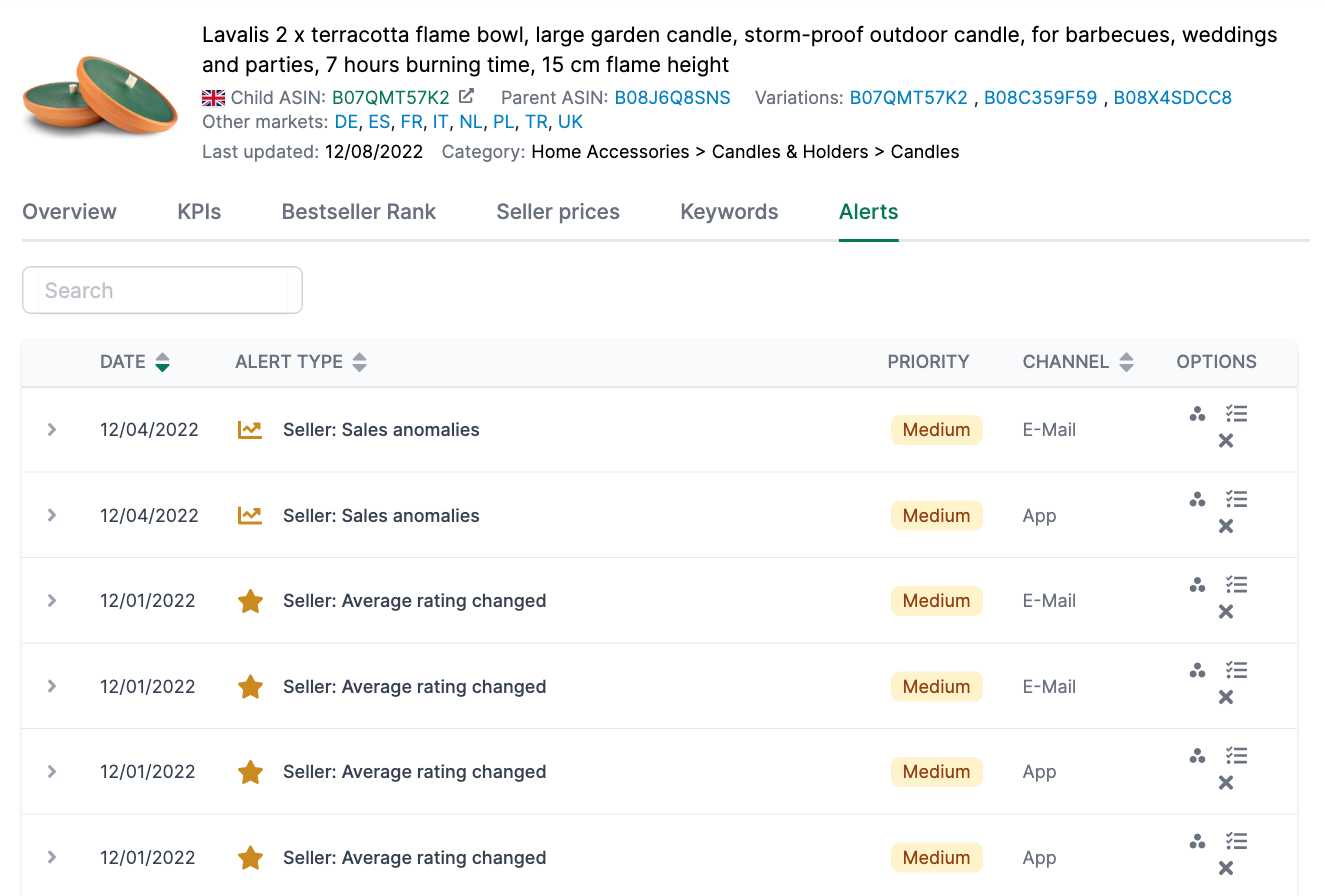
For each alert, you can:
- Create a To-Do to track the task
- Create an Asana task (if Asana is connected)
- Hide the alert if it is not relevant
Revenue per Day/Hour (Vendor only)
This tab is only available for Vendor products and shows you the hourly or daily distribution of your sales. This helps you identify:
- At what times of day most sales occur
- Whether there are patterns in your sales
- How seasonal effects impact daily sales patterns
Snapshot Monitoring (Watchlist only)
For Watchlist products, you can use Snapshot Monitoring to track how a competitor listing’s content changes. This shows you exactly what changes were made to the title, bullet points, description, or images.
Last Changes (Watchlist only)
The Last Changes tab shows the history of all content changes detected on a Watchlist product. This allows you to track your competitors’ optimization activities.